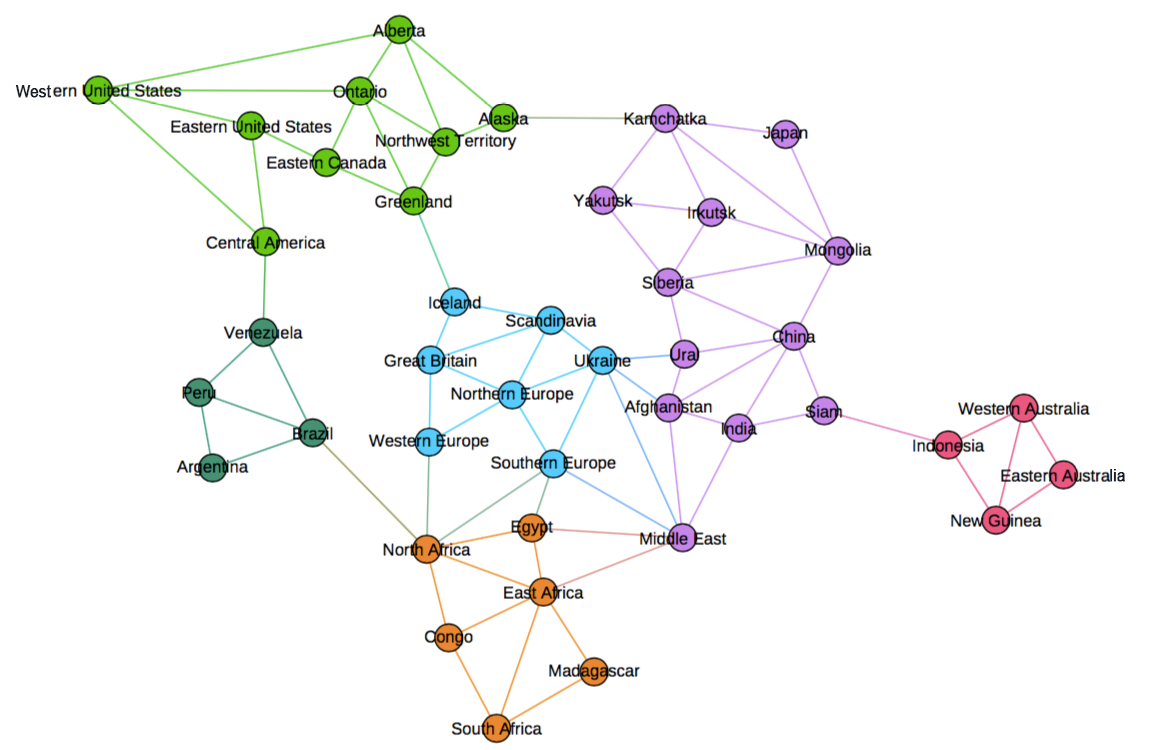
For the following questions, refer to Figure 1.
Identify which node(s) have the highest degree and state this degree.
Identify which node(s) have the highest degree centrality and this metric's value.
Identify which node(s) have the highest closeness centrality and this metric's value.
Identify which node(s) have the highest betweenness centrality and this metric's value.
Compare the node sets for each of these centrality measures. Are they the same? If not, provide a brief discussion on why you think they are different.
ANSWER FOR RISK BOARD: For the Risk board, we see some differences among the three centrality measures: The set of nodes with highest degree centrality contains the nodes with highest closeness and betweenness centrality, but Ukraine is the average closest node, whereas North Africa is the best bridging node with highest betweenness centrality. I posit they are different because, while Ukraine has the most access to different countries, North Africa provides a gateway to all of Africa and South America.
ANSWER FOR METRO MAP: Node N is consistently the most central node across all three metrics.
Calculate the connectivity/cohesion for this graph.
Draw the 1-degree egocentric network for node Ukraine.

Draw the 1.5-degree egocentric network for node Ukraine and calculate this network's density.
ANSWER: With Ukraine, the density is 0.5238

ANSWER: If you remove Ukraine from the 1.5-degree ego-net, the density is 0.3333.

Calculate the local clustering coefficient for nodes Ukraine, Congo, and Argentina.

For the remaining questions, refer to Figure 2.
Using the same number of nodes, draw a graph with the highest unnormalized degree centralization score.

Calculate the degree centralization score of the graph you are given; then calculate its normalized degree centralization value using your graph above.
ANSWER: The degree centralization score for the metro graph is 3.056.


To normalize this centralization score, we need to divide by the maximum possible centralization metric for a network with the same number of nodes (i.e., the graph you constructed above), which results in a normalized centralization of 3.056 / 17 = 0.1797.